


Accurate Testing, Adjusting, and Balancing (TAB) of cleanrooms and allied containment devices is the foundation of contamination control. Whether validating against ISO 14644 standards or EU GMP Annex 1 requirements, a facility’s integrity depends entirely on the precision of its diagnostic measurements.
Beyond regulatory compliance, the precision of these measurements determines the energy efficiency of the entire HVAC system. Systemic errors in measuring differential pressure (DP) and air velocity can lead to false passes, compromised product integrity, and substantial, hidden energy waste. Below is an analysis of the most common measurement errors across critical applications and the energy-saving benefits of eliminating them.
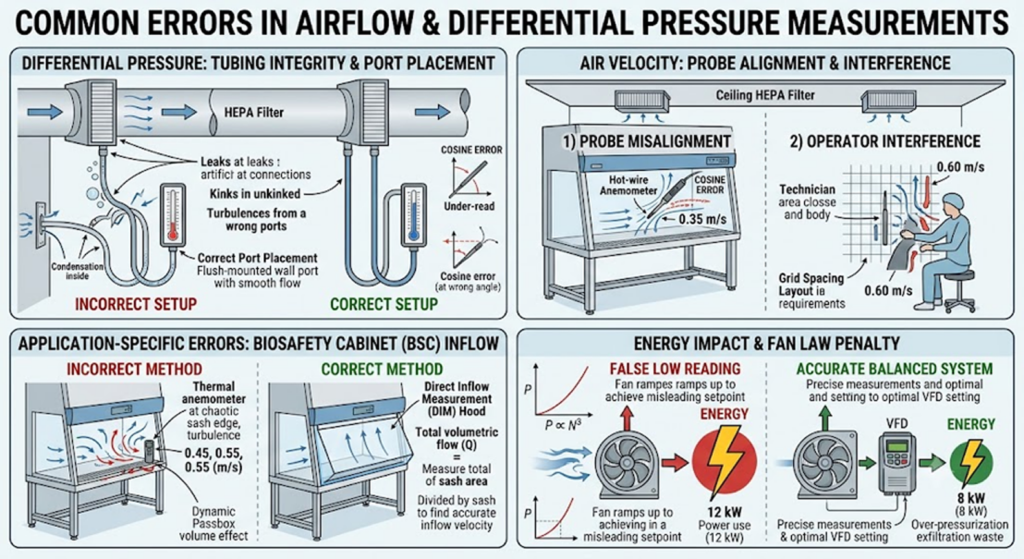
Part 1: Errors in Differential Pressure (DP) Measurement
Differential pressure is the primary means of maintaining clean zone cascades and monitoring filter loading. Errors here typically stem from poor setup and environmental oversight.
- Tubing and Pneumatic Integrity Failures
- Leakage and Micro-Tears: Even microscopic leaks in the pneumatic tubing linking the high- and low-pressure ports to the manometer will bleed off pressure, producing artificially low readings. This is a common oversight when assessing HEPA and prefilter pressure drops.
- Kinks and Compression: Polyurethane or silicone tubing routed through tight spaces or pinched by cabinet doors restricts the pneumatic signal, slowing response time and masking transient pressure fluctuations.
- Condensation Blockage: In high-humidity environments or where there are significant temperature differentials, condensation can pool in the DP tubing. Water acts as a plug, completely invalidating the pressure reading.
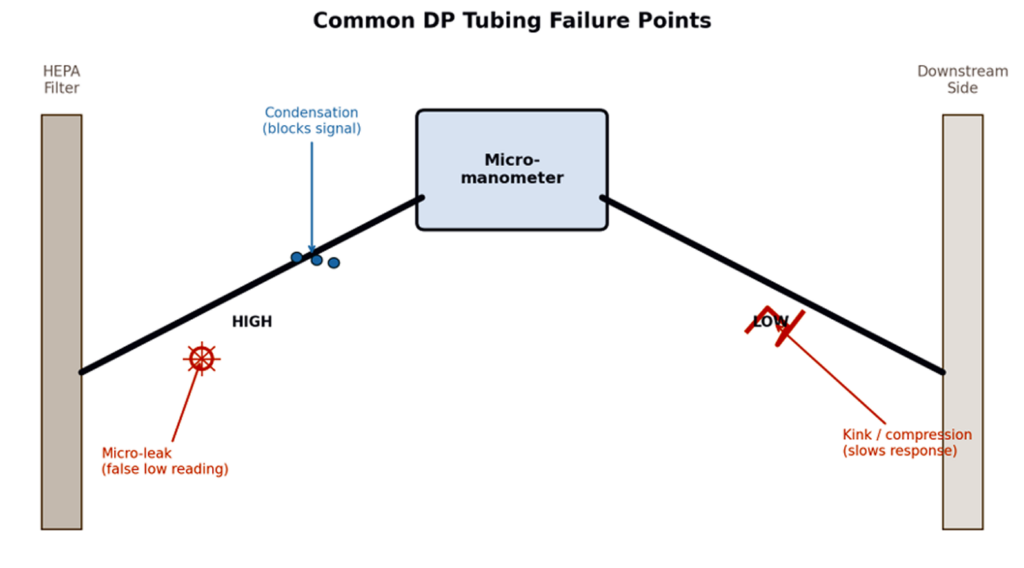
Figure 1. Common pneumatic tubing failure points that corrupt DP readings.
- Improper Port Location and Static Pressure Errors
- Turbulence Interference: Positioning the static pressure probe too close to a fan discharge, a damper, or a sharp duct transition subjects it to dynamic velocity pressure rather than pure static pressure.
- Flush Mounting Failures: In cleanrooms, flush-mounted wall ports must be perfectly level with the wall surface. Protruding ports disrupt localised airflow, creating localised high- or low-pressure zones (the Bernoulli effect) that skew cascade measurements.
- Failure to Account for Zero-Drift and Reference Calibration
- Neglecting Auto-Zeroing: Electronic micromanometers are susceptible to temperature-induced zero drift. Failing to zero the instrument under the exact environmental conditions of the test will introduce a systematic offset—a critical failure when measuring tight cascade tolerances of 10 to 15 Pa.
Part 2: Errors in Air Velocity Measurement
Air-velocity profiling determines the effectiveness of unidirectional airflow in Laminar Flow (LAF) benches, Biosafety Cabinets (BSCs), Dynamic Passboxes (DPBs), and cleanrooms.
- Probe Misalignment (The Cosine Error)
- Angular Deviation: Both hot-wire (thermal) anemometers and vane anemometers must be positioned perfectly perpendicular (90 degrees) to the airflow. Even a 10-15-degree angular deviation can cause a significant drop in the measured velocity due to the cosine effect.
- Rotational Misalignment: Thermal anemometer sensors often have a specific “direction of flow” indicator. Rotating the probe away from the direct airstream produces erratic, falsely low readings.
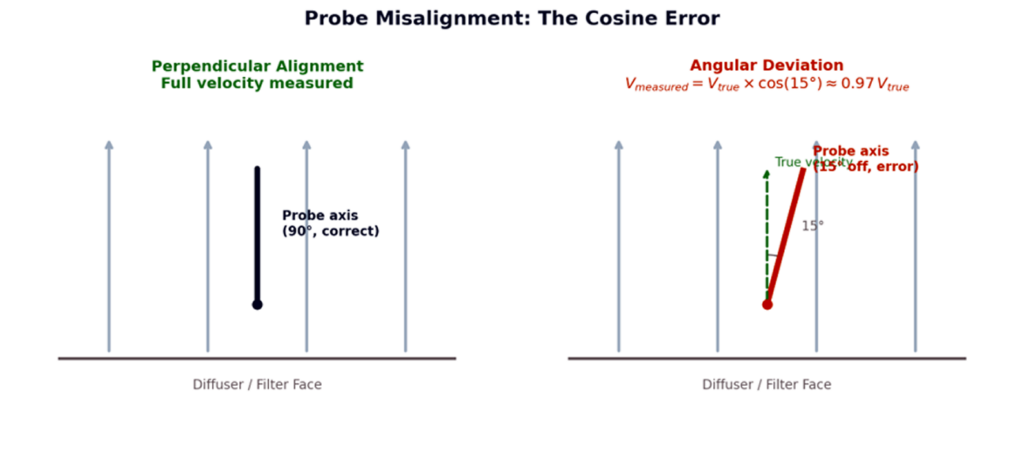
Figure 2. The cosine error: even a small angular deviation reduces the measured velocity component.
- Operator-Induced Turbulence
- Body Obstruction: The technician’s body acts as a large bluff body. Standing directly downstream or adjacent to the measurement point forces the air to compress and accelerate around the technician, causing artificially high velocity readings at the probe.
- Grid Spacing and Sampling Density Non-Compliance
- Insufficient Sampling Points: Failing to adhere to the grid spacing mandated by ISO 14644-3 results in an incomplete velocity profile. Technicians taking random spot measurements can easily miss localised dead zones or high-velocity jets.
- Edge Proximity: Taking readings too close to the side walls of a BSC or DPB, without accounting for boundary-layer friction, skews the average velocity calculation.
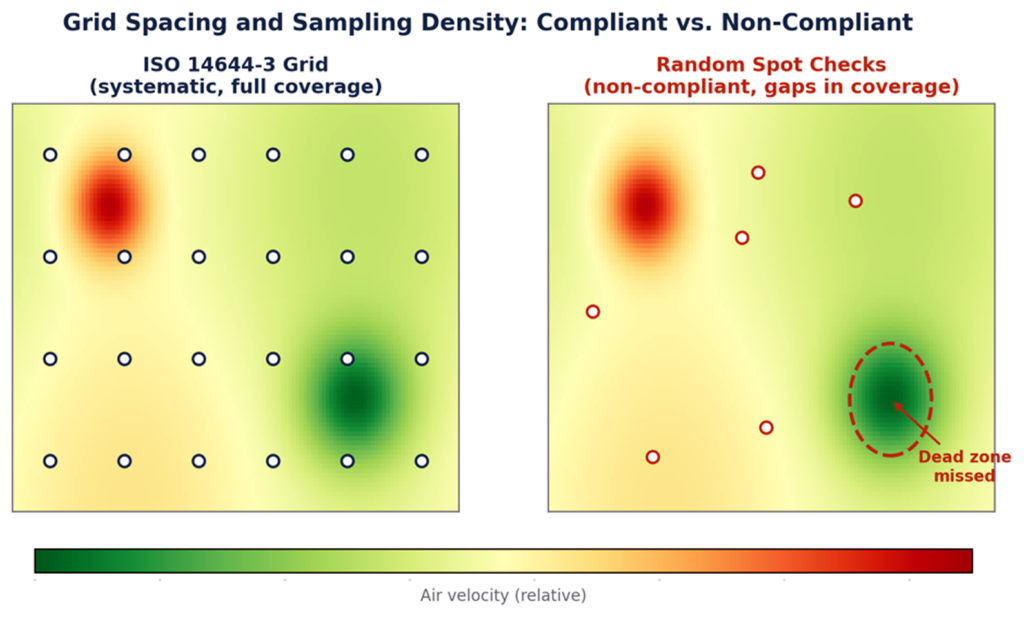
Figure 4. A compliant ISO 14644-3 grid catches dead zones that random spot checks miss.
Part 3: Application-Specific Pitfalls
- Biosafety Cabinets (BSCs): Measuring the inflow velocity of a Class II BSC using a thermal anemometer at the front access opening is highly prone to error due to extreme turbulence. A direct inflow measurement (DIM) hood should be used to measure total volumetric flow.
- Reverse Laminar Airflow (RLAF): Technicians frequently measure the central downflow velocity but neglect to rigorously measure the boundary air velocity at the safe-working perimeter, which is the actual vector that prevents operator exposure.
- Dynamic Passboxes (DPBs): Because DPBs are confined spaces, inserting the measurement probe and the technician’s arm physically alters the internal volume and airflow dynamics. Measurements must be taken with minimal intrusion.
- Prefilters & HEPA Filters: Measuring the pressure drop across a filter bank without confirming that the AHU is operating at its design airflow volume yields a falsely reassuring low pressure drop, masking a potentially loaded filter.
Part 4: The Energy-Saving Advantages of Accurate Diagnostics
Correcting the errors outlined above is not merely a compliance exercise; it is a critical strategy for optimising energy consumption in facilities. Inaccurate measurements force HVAC systems to work harder than necessary.
- Combating the Fan Affinity Law Penalty
When technicians record falsely low air velocity readings (due to angular deviation, poor grid spacing, or thermal interference), the standard response is to increase the fan speed via the Variable Frequency Drive (VFD) to achieve the “correct” airflow. The relationship between fan speed () and power consumption () is governed by the fan affinity laws, expressed as:
Those variables are part of the fan affinity laws, fundamental equations in HVAC engineering that predict how changes in fan speed affect air volume, pressure, and power consumption.
In the specific formula The variables stand for the following:
- P1 (Initial Power): The baseline power consumption of the fan motor. This is typically measured in kilowatts (kW) or brake horsepower (BHP) at its current operating speed.
- P2 (Final Power): The resulting power consumption after the fan speed has been adjusted.
- N1 (Initial Speed) The fan’s original rotational speed. This is usually measured in revolutions per minute (RPM) or indicated as a frequency on a Variable Frequency Drive (e.g., 40 Hz).
- N2 (Final Speed)The new rotational speed of the fan after adjusting airflow requirements.
Why This Matters in Practice
The most critical takeaway from this formula is the cube at the end. This means that power consumption does not increase linearly with speed; it increases exponentially.
If a technician records a falsely low velocity reading due to a probe error and increases the fan speed by just 10% (so is 1.1 times ), the new power requirement () isn’t 10% higher. Because . The power consumption actually jumps by 33%.
This mathematical relationship is exactly why accurate diagnostic measurements are so critical to preventing massive energy waste in cleanrooms and containment systems.
Because power consumption increases with the cube of the fan speed, compensating for even a 10% false-low velocity reading requires a 33% increase in fan energy use. Accurate velocity measurement ensures fans operate at their true minimum required setpoints.
- Optimising Filter Lifecycle and Static Pressure
Artificial pressure drops caused by pinched tubing, micro-leaks, or uncalibrated manometers often prompt facility managers to replace HEPA and prefilters prematurely. Accurate DP measurements ensure filters are changed only when genuinely loaded. Furthermore, running fans against falsely assumed high static pressures forces the motor to draw excess current. Precise DP readings enable optimal VFD tuning, reducing the continuous electrical burden on AHU motors.
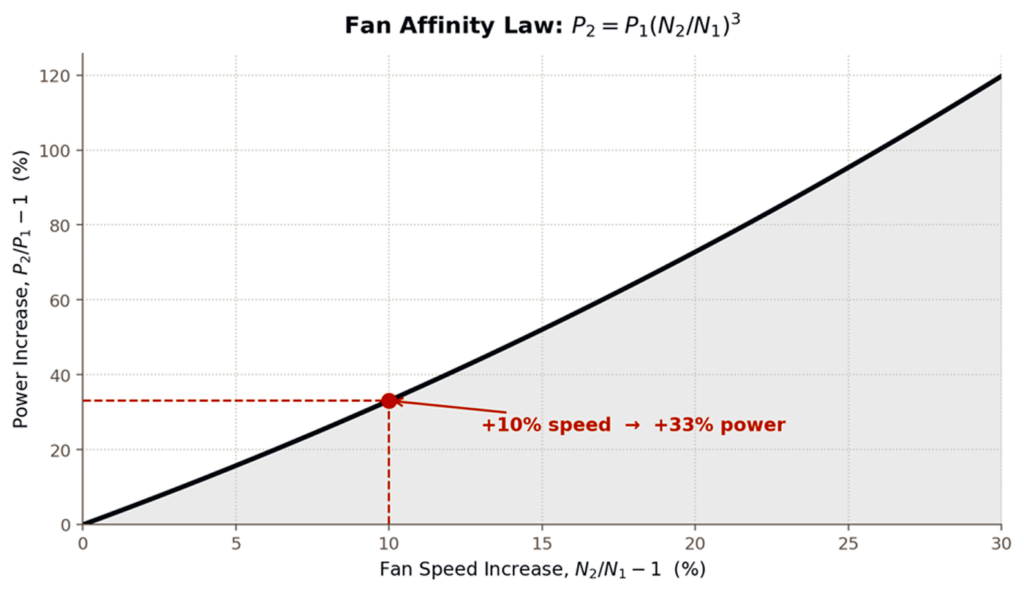
Figure 3. Power scales with the cube of fan speed — a 10% speed correction costs 33% more energy.
- Minimising Exfiltration and Conditioned Air Waste
Flush-mounting failures and zero-drift errors in room cascades frequently cause over-pressurisation. If a cleanroom is excessively pressurised beyond its design threshold (e.g., 25 Pa instead of 15 Pa), highly treated, filtered, and temperature-controlled air is forced out of the envelope through microscopic cracks, doors, and passboxes. Accurate cascade balancing drastically reduces the exfiltration of expensive conditioned air.
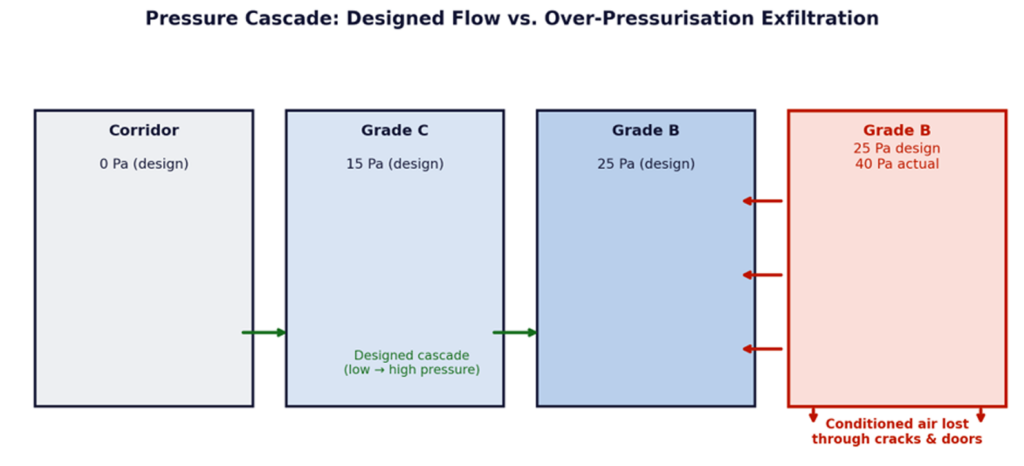
Figure 5. Over-pressurisation drives conditioned air out through cracks, doors, and passboxes.
- Reducing Parasitic Cooling Loads
Fan motors generate heat. When VFDs are ramped up to compensate for inaccurate velocity or pressure readings, the additional motor heat is introduced directly into the airstream. This creates a parasitic load on the chiller plant, requiring the chilled-water valves to open further to cool the air back down. Precise TAB diagnostics directly reduce motor heat generation, compounding energy savings at the chiller level.
References
[1] ISO 14644-1:2015 — Cleanrooms and associated controlled environments — Part 1: Classification of air cleanliness by particle concentration.
[2] ISO 14644-3:2019 — Cleanrooms and associated controlled environments — Part 3: Test methods.
[3] European Commission, EudraLex Volume 4, Annex 1 (2022) — Manufacture of Sterile Medicinal Products.
[4] ASHRAE Handbook — Fundamentals, Chapter on Fans and Fan Applications (fan affinity laws).
[5] NEBB Procedural Standards for Testing, Adjusting, and Balancing of Environmental Systems.
[6] AABC National Standards for Total System Balance.
© 2026 ALM Engineering and Instrumentation Private Limited, Mumbai, India. All rights reserved.
This document is provided for general informational and educational purposes only and does not constitute engineering, regulatory, or professional advice. While reasonable care has been taken in its preparation, no warranty, express or implied, is made as to the accuracy, completeness, or applicability of the information to any specific facility or situation. Readers should independently verify requirements against the current, applicable standards (including ISO 14644, EU GMP Annex 1, and relevant local regulations) and consult qualified professionals before making design, operational, or compliance decisions. No part of this document may be reproduced, distributed, or transmitted in any form without the prior written permission of ALM Engineering and Instrumentation Private Limited, except for brief quotations used in reviews or non-commercial reference with appropriate attribution.